Dataflows: Difference between revisions
m Created page with 'The data model of solvers is always arbitratry, sometimes proprietary and almost never generic. In simantics environment, the data is exposed in the format of [[Databoard_Specif...' |
No edit summary |
||
| (2 intermediate revisions by 2 users not shown) | |||
| Line 15: | Line 15: | ||
===UC 1: Run an local experiment=== | ===UC 1: Run an local experiment=== | ||
[[image:local_experiment.png|The dataflows in a local experiment]] | [[image:local_experiment.png|480px|The dataflows in a local experiment]] | ||
Experiment is executed locally in the Simantics Workbench application. | Experiment is executed locally in the Simantics Workbench application. | ||
| Line 30: | Line 30: | ||
===UC 2: Run a remote experiment=== | ===UC 2: Run a remote experiment=== | ||
[[image:remote_experiment.png|The dataflows in a remote experiment]] | [[image:remote_experiment.png|480px|The dataflows in a remote experiment]] | ||
Experiment is executed in a remote process called Task Manager. | Experiment is executed in a remote process called Task Manager. | ||
| Line 38: | Line 38: | ||
===UC 3: Persist an experiment result=== | ===UC 3: Persist an experiment result=== | ||
[[image:archive.png|Put the experiment result into an archive]] | [[image:archive.png|480px|Put the experiment result into an archive]] | ||
Experiment is persisted into a local archive. Local archive stores the experiment as files in the workspace folder of Simantics Workbench application. | Experiment is persisted into a local archive. Local archive stores the experiment as files in the workspace folder of Simantics Workbench application. | ||
| Line 48: | Line 48: | ||
===UC 4: Visualize a recorded experiment=== | ===UC 4: Visualize a recorded experiment=== | ||
[[image:visualize_archive.png|Visualize a persisted experiment]] | [[image:visualize_archive.png|480px|Visualize a persisted experiment]] | ||
Chart component visualizes the data from a memory cache. It renders data only in [[Databoard_Specification#History_Contract|History Contract]] format. | Chart component visualizes the data from a memory cache. It renders data only in [[Databoard_Specification#History_Contract|History Contract]] format. | ||
| Line 55: | Line 55: | ||
==Links== | ==Links== | ||
* [[ | * [[Task protocol]] | ||
[[Category: Data management & Experiment Control]] | |||
Latest revision as of 15:57, 28 January 2011
The data model of solvers is always arbitratry, sometimes proprietary and almost never generic. In simantics environment, the data is exposed in the format of Datasource Contract by implementing Accessor Interface. It gives the access means to read, browse and monitor the data models.
The values of variables can be monitored in Simantics Workbench desktop client. Values are followed in a property viewer component on the left-hand side of the workspace. There are monitor objects on a diagram, that follow values of variables at real-time as the experiment progresses. Charts visualizations draw the trends of the variables, from their collected samples, at real-time or after experiment.
An experiment may be recorded by collecting samples. A sampling may contain all values of all variables, a sub-set of values, and/or a sub-set of variables. SamplingConfiguration defines how samples are collected from the variables during the experiment. The result is stored in the format of History Contract.
Use Cases
UC 1: Run an local experiment
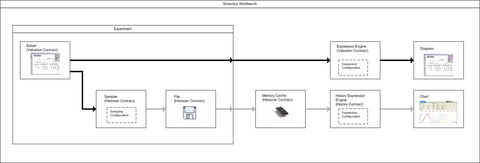
Experiment is executed locally in the Simantics Workbench application. Experiment controller exposes two features: datasource and history. See Task_protocol for more details.
The simulation time data is in Datasource Contract format. Values are viewed in property viewer, monitors on diagram, and in a visualizing charts.
Experiment Controller also records the data into time series. The format of the time series is defined in History Contract. Subscripion Configuration desribes what variables are recorded and how sampled.
Chart configuration includes Expression Configuration.
UC 2: Run a remote experiment
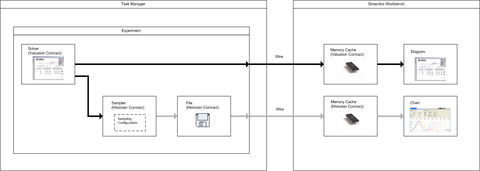
Experiment is executed in a remote process called Task Manager. The values are accessed using Wire protocol and cached in Simantics Workbench application. Values are cached in memory before used by higher level UI components. Partial Accessor implementation provides caching features.
UC 3: Persist an experiment result
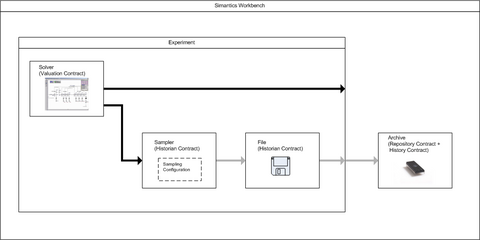
Experiment is persisted into a local archive. Local archive stores the experiment as files in the workspace folder of Simantics Workbench application.
Data structure of the archive is in Repository Contract format. Basicly, it consists of folders and values nodes. Value node contains a recording of an experiment. The folder hierarchy of the archive is organized by the end user. An experiment recording is stored in a single file. The file contains a single Sampling value.
UC 4: Visualize a recorded experiment
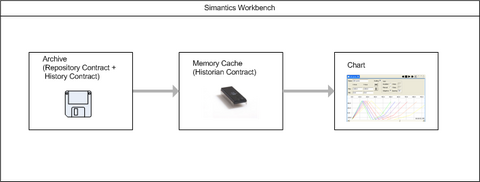
Chart component visualizes the data from a memory cache. It renders data only in History Contract format.
Chart configuration is source neutral. Same configuration can be used to render both cached real-time data and stored history data.


